


Tracking Horse and Rider Speed During Warm-Up and CCI4* Short and Long Format Eventing Cross-Country Using a Commercial Wearable GPS Sensor.
Ever wondered how much time and how elite riders spend warming up? How do elite riders pace themselves cross-country? What are typical jump speeds versus speeds between fences? Do speed and pacing strategy influence time penalties?
New wearable technology has meant we have the potential to easily collect detailed data in circumstances that were previously challenging. We have just published this paper using the Catapult system to track horse and rider speed and position, and rider movement up to 100 times per second with high accuracy during cross-country using technology routinely used in professional rugby, as well as football, and many other sports.
This was made possible through the loan of equipment by Catapult and through seed funding from the British Equestrian World Class Programme. The study was undertaken by Dr David Marlin (Animalweb and Team GB Equine and Scientific Advisory Group member), Dr Russell McKechnie-Guire (Hartpury University, Centaur Biomechanics and Team GB Equine and Scientific Advisory Group member), Dr Heather Cameron-Whytock (University of Lancashire) and Dr Andrew Lombard (Catapult and University of Edinburgh).
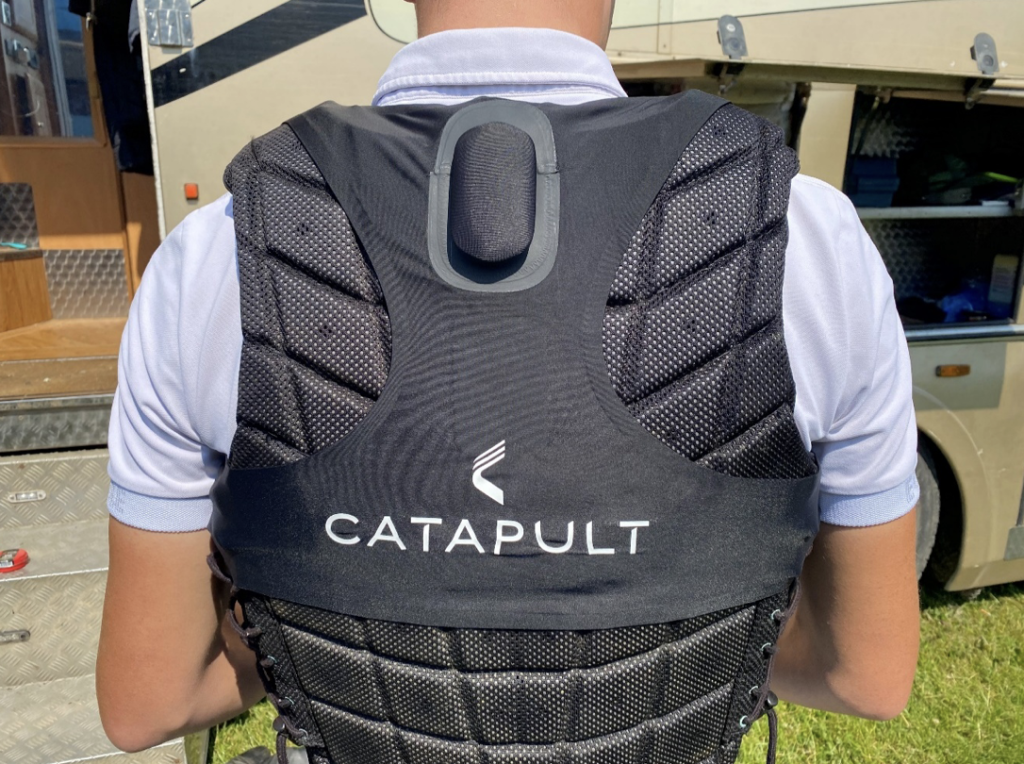
The research group monitored volunteer Team GB squad riders competing at Bramham Horse Trials. The riders wore a sensor over their body-protector or back-protector but under their air-jacket. Seven combinations were monitored during warm-up and cross-country in the CCI4*L, and 11 combinations were monitored in the CCI4*S. Riders spent around 30 minutes warming up for the CCI4*L compared with 21 minutes for the CCI4*S. Variation in speed was around 23% for both courses. On average, riders in both classes jumped fences at around 400m/min. Although average speeds were around 525-550m/min, in order to make up time, riders reached speeds as high as nearly 700m/min between fences to make up time.
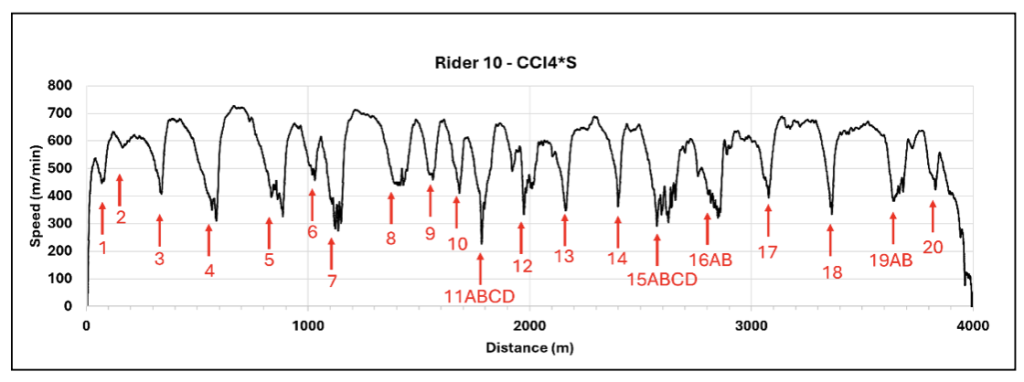
Above is an example of speed (m/min) versus distance (m) for rider 10 in the CCI4*S.
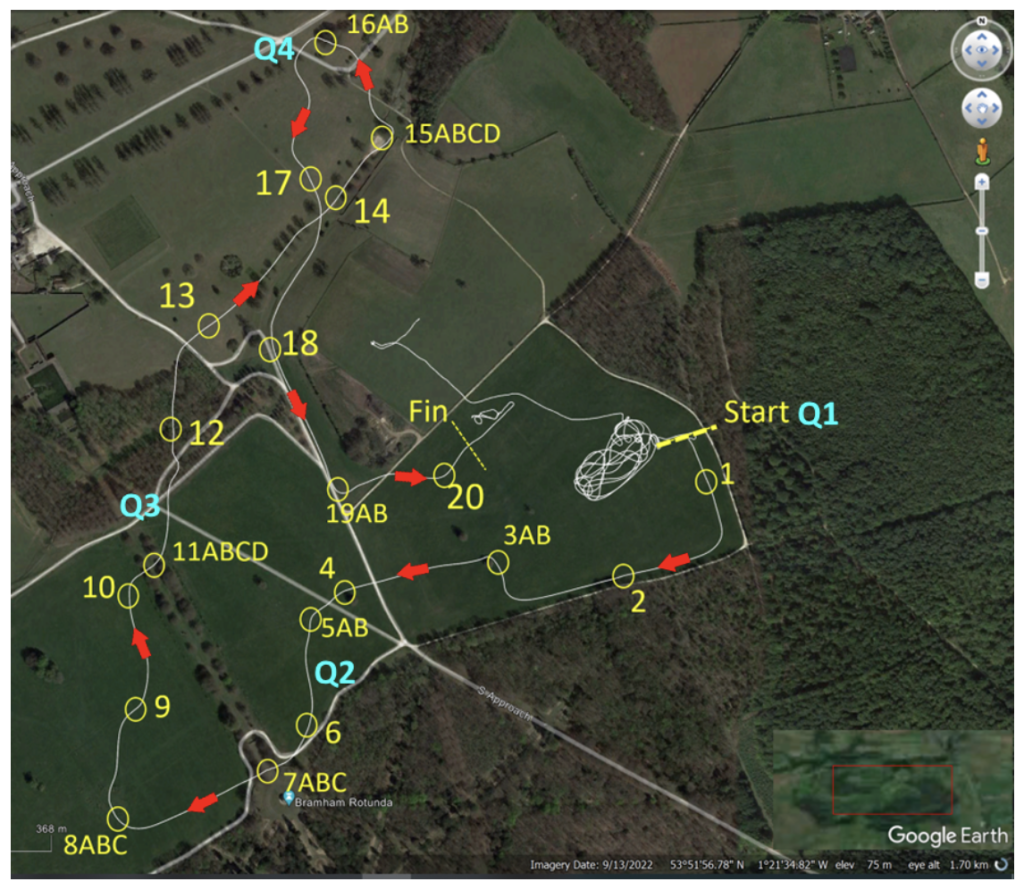
The above image shows an actual track taken by rider 10 in CCI4*S cross-country overlaid on Google Earth (white line) using the exported latitude and longitude data from Catapult. Jump locations marked in yellow. The start of each quarter of the course is marked by blue Q1 – Q4. Red arrows show the direction of travel.
Why is this insight important?
High variance in speed over the cross-country course and very low or very high fence approach speeds may potentially play a role in fatigue and or fall risk and warrant further study. A larger study funded by British Eventing and Animalweb is currently being written up for publication.
Reference: Marlin, D. J., McKechnie-Guire, R. ., Cameron-Whytock, H. ., & Lombard, A. (2026). Tracking Horse and Rider Speed During Warm-Up and CCI4* Short and Long Format Cross-Country Using a Commercial Wearable GPS Sensor. International Journal of Equine Science, 5(1), 60–70. Click here for the link.
